The shapper is an R package which ports the shap python library in R. For details and examples see shapper repository on github and shapper website.
SHAP (SHapley Additive exPlanations) is a method to explain predictions of any machine learning model. For more details about this method see shap repository on github.
To run shapper python library shap is required. It can be installed both by python or R. To install it throught R, you an use function install_shap from the shapper package.
shapper::install_shap()
The example usage is presented on the HR dataset from the R package DALEX. For more details see DALEX github repository.
library("DALEX")
Y_train <- HR$status
x_train <- HR[ , -6]
library("randomForest")
set.seed(123)
model_rf <- randomForest(x = x_train, y = Y_train)

library(rpart)
model_tree <- rpart(status~. , data = HR)
First step is to create an explainer for each model. The explainer is an object that wraps up a model and meta-data.
library(shapper)

p_function <- function(model, data) predict(model, newdata = data, type = "prob")

ive_rf <- individual_variable_effect(model_rf, data = x_train, predict_function = p_function,
            new_observation = x_train[1:2,], nsamples = 50)


ive_tree <- individual_variable_effect(model_tree, data = x_train, predict_function = p_function,
            new_observation = x_train[1:2,], nsamples = 50)
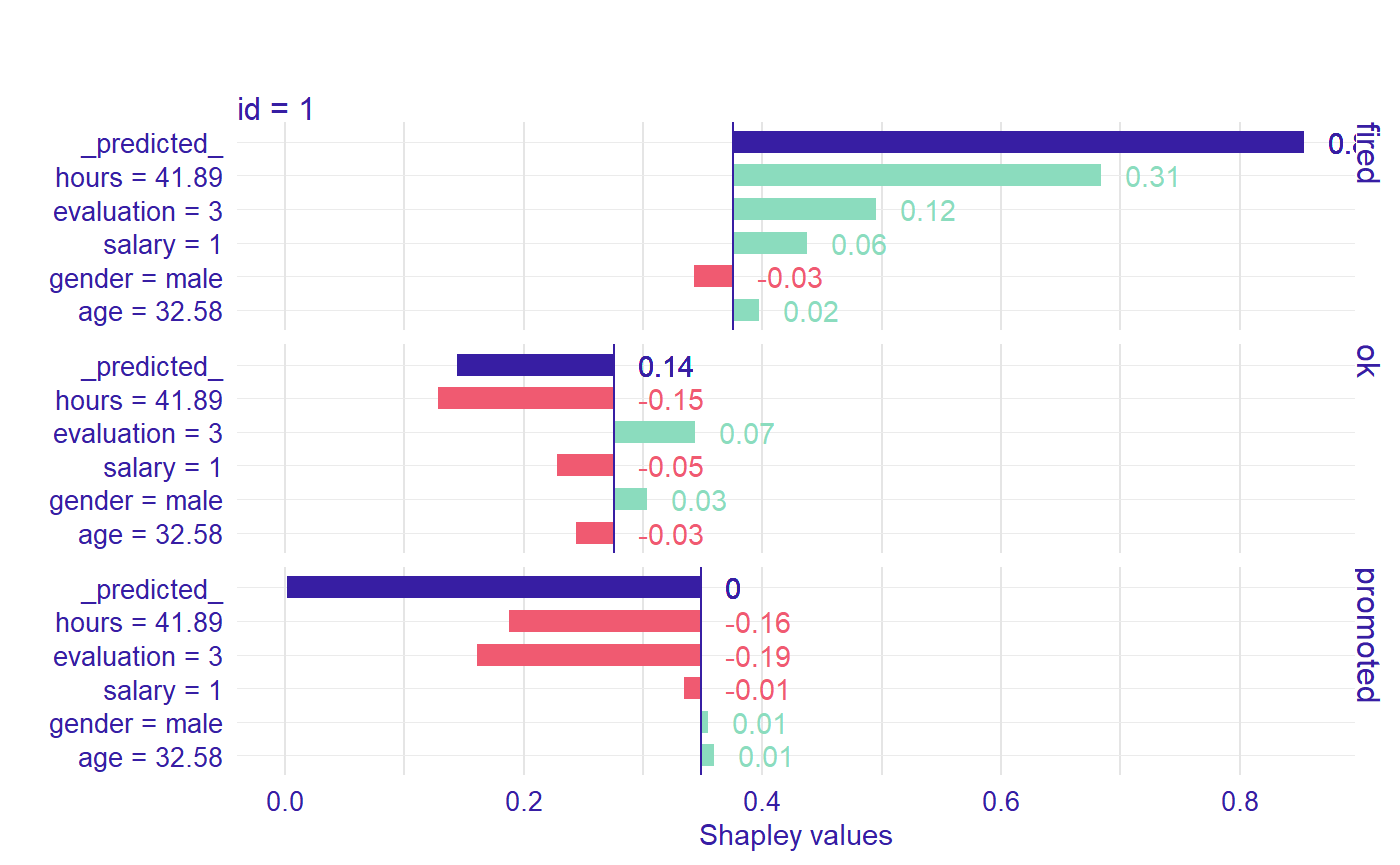
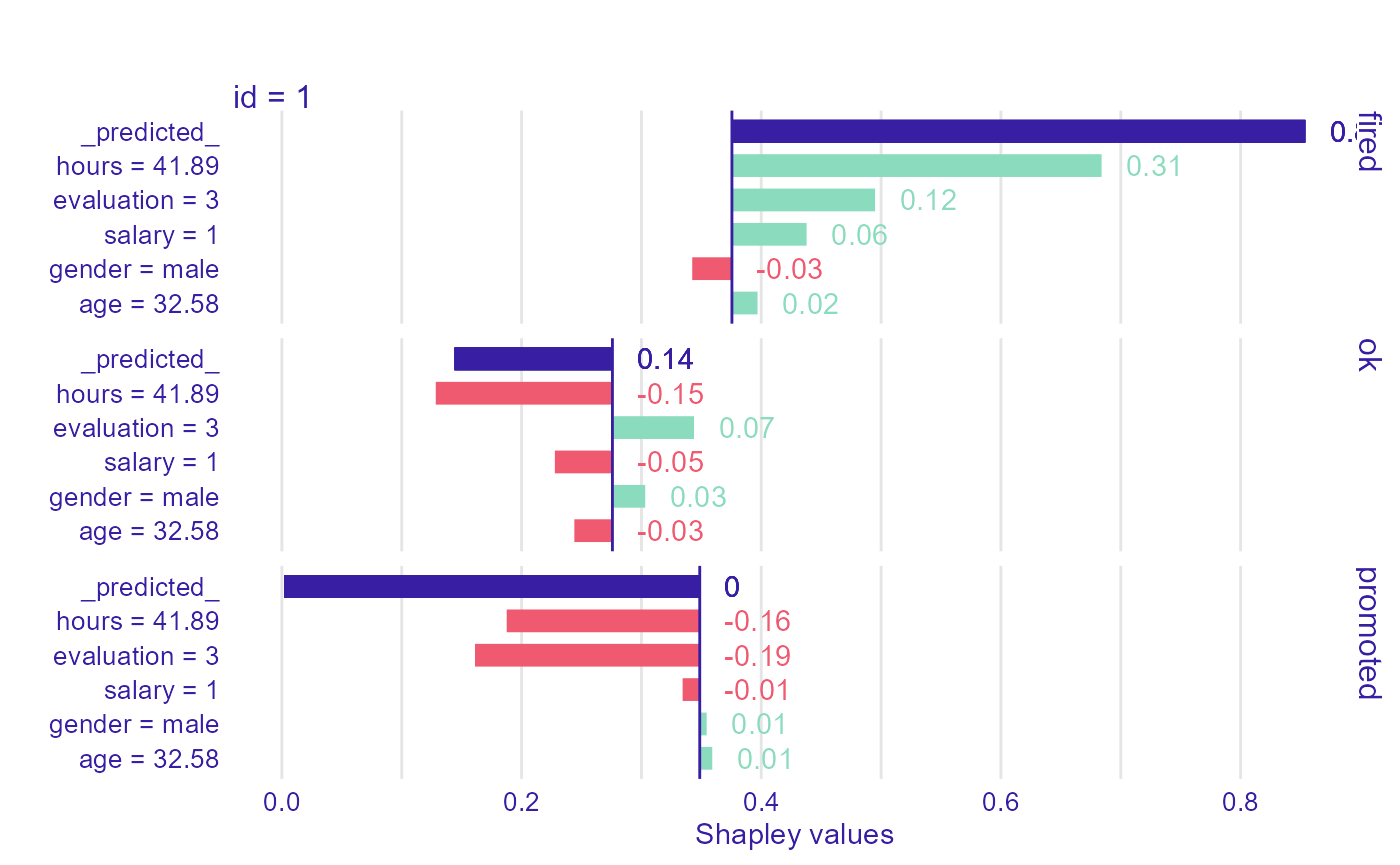
ive_rf
plot(ive_rf, bar_width = 4)
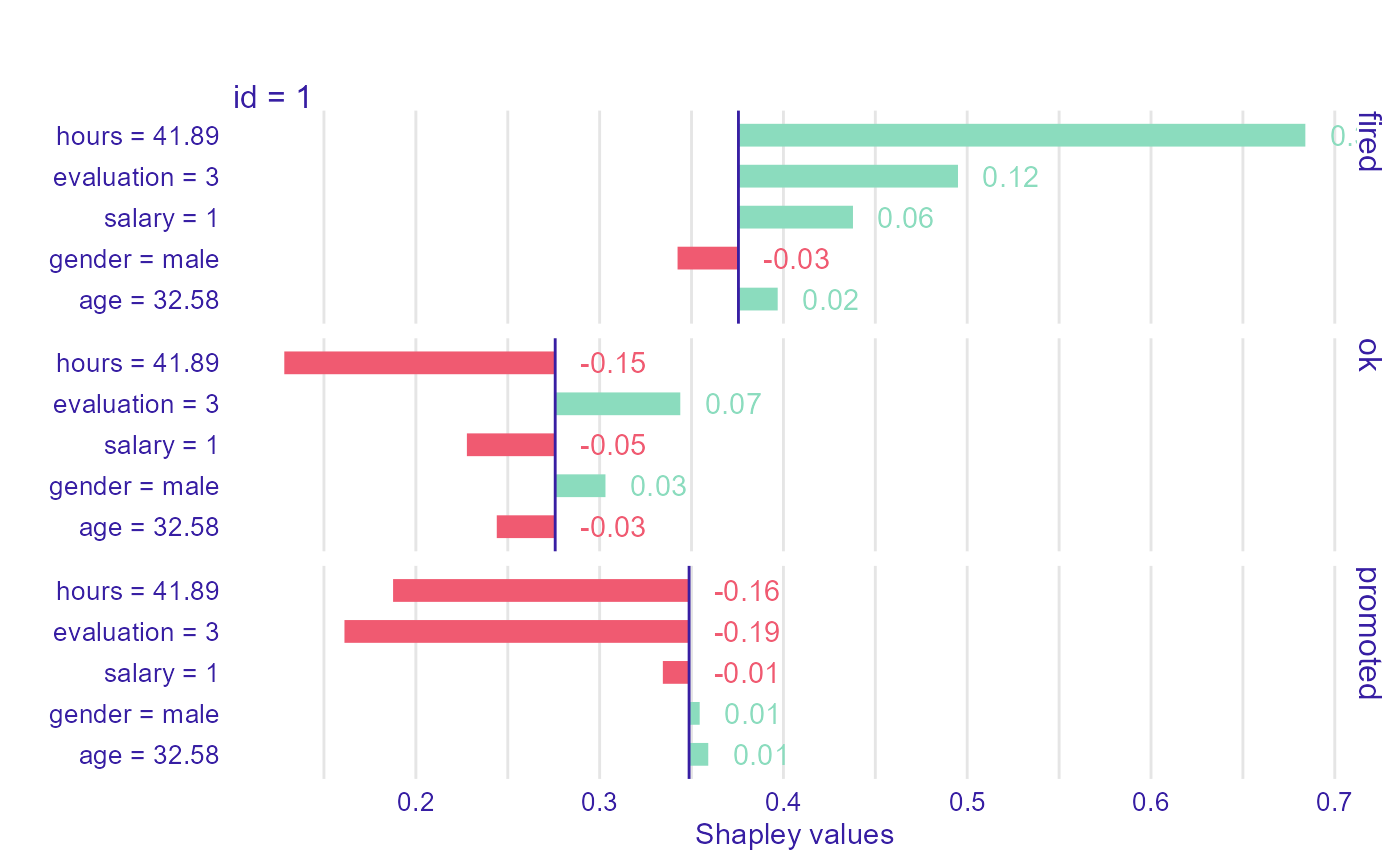
To see only attributions use option show_predicted = FALSE.
plot(ive_rf, show_predicted = FALSE, bar_width = 4)
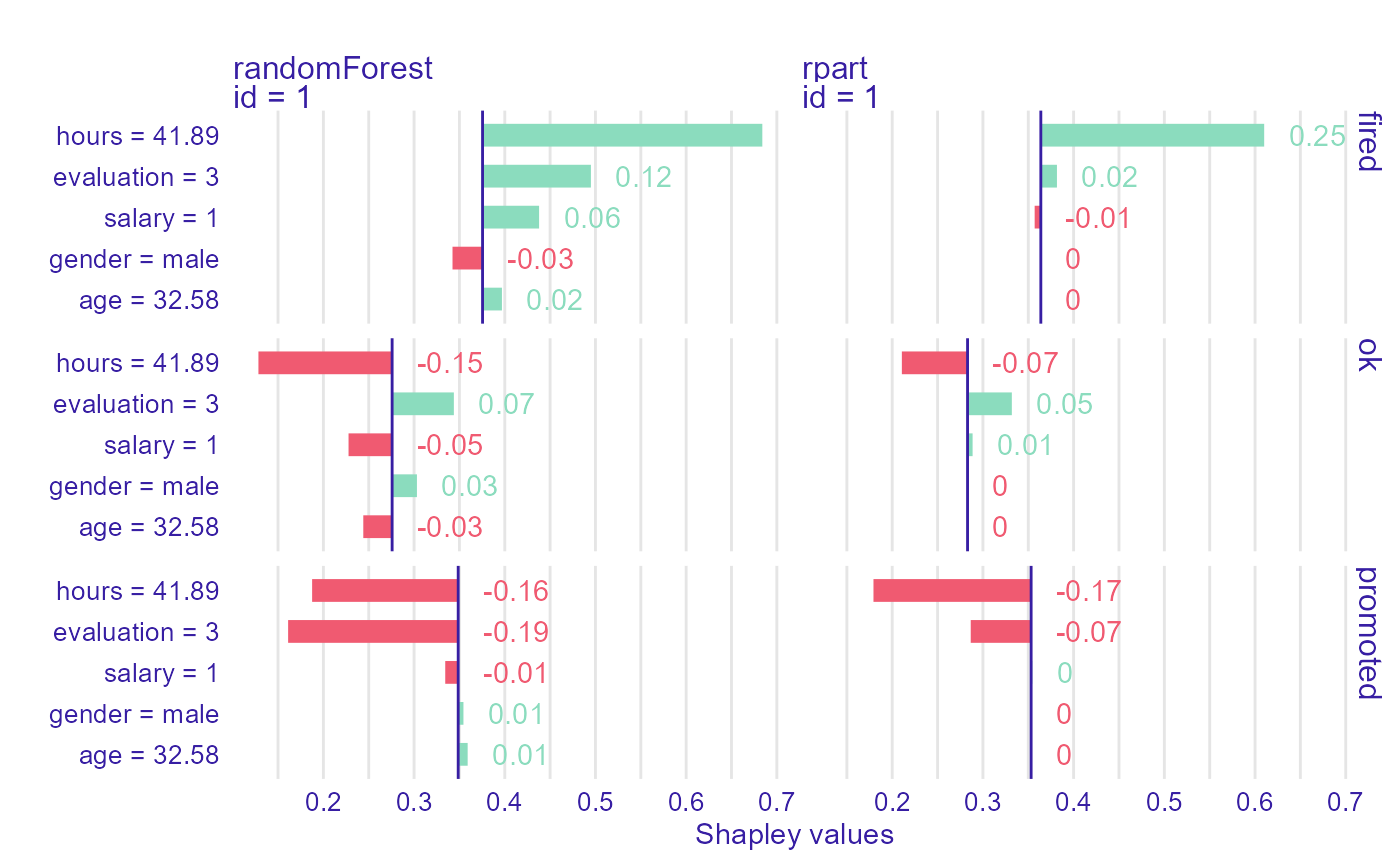
We can show many models on one grid.
plot(ive_rf, ive_tree, show_predicted = FALSE, bar_width = 4)
ive_rf_filtered <- ive_rf[ive_rf$`_ylevel_` =="fired", ]
shapper:::plot.individual_variable_effect(ive_rf_filtered)