![]()
You can install the package from CRAN:
install.packages("edibble")You can install the development version with:
# install.packages("remotes")
remotes::install_github("emitanaka/edibble")The goal of edibble R-package is to aid in the plan,
design and simulation of experiments by mapping fundamental components
of experiments to an object oriented system. The edibble
system is built on the principle that the system must make it easy to
recover experimental context by encouraging the user to be explicit
about experimental details in fundamental terms.
Consider an experiment where you want to know what is an effective way of teaching (flipped or traditional style) for teaching a particular subject and how different forms of exams (take-home, open-book or closed-book) affect student’s marks.
There are four classes for this subject with each class holding 30 students. The teaching style can only be applied to the whole class but exam can be different for individual students.
library(edibble)

set.seed(2020)

des <- design(name = "Effective teaching") %>%
    set_units(class = 4,
              student = nested_in(class, 30)) %>%
    set_trts(style = c("flipped", "traditional"),
             exam = c("take-home", "open-book", "closed-book")) %>%
    allot_trts(style ~ class,
               exam ~ student) %>%
    assign_trts("random")

serve_table(des)
#> # An edibble: 120 x 4
#>     class    student       style        exam
#>    <U(4)>   <U(120)>      <T(2)>      <T(3)>
#>     <chr>      <chr>       <chr>       <chr>
#>  1 class1 student001 traditional   take-home
#>  2 class1 student002 traditional   take-home
#>  3 class1 student003 traditional   take-home
#>  4 class1 student004 traditional   open-book
#>  5 class1 student005 traditional closed-book
#>  6 class1 student006 traditional closed-book
#>  7 class1 student007 traditional closed-book
#>  8 class1 student008 traditional   open-book
#>  9 class1 student009 traditional   open-book
#> 10 class1 student010 traditional   open-book
#> # ℹ 110 more rows
Before constructing the experiment, you might want to think about what you are recording for which level of unit and what values these variables can be recorded as.
out <- des %>%
    set_rcrds_of(student = c("exam_mark",
                             "quiz1_mark",
                             "quiz2_mark",
                             "gender"),
              class = c("room",
                        "teacher")) %>%
    expect_rcrds(exam_mark <= 100,
                 exam_mark >= 0,
                 quiz1_mark <= 15L,
                 quiz1_mark >= 0L,
                 quiz2_mark <= 30L,
                 quiz2_mark >= 0L,
                 factor(gender, levels = c("female", "male", "non-binary", "unknown"))) %>%
    serve_table()

out
#> # An edibble: 120 x 10
#>     class    student     style     exam exam_mark quiz1_mark quiz2_mark   gender
#>    <U(4)>   <U(120)>    <T(2)>   <T(3)>  <R(120)>   <R(120)>   <R(120)> <R(120)>
#>     <chr>      <chr>     <chr>    <chr>     <dbl>      <dbl>      <dbl>    <dbl>
#>  1 class1 student001 traditio… take-ho…         o          o          o        o
#>  2 class1 student002 traditio… take-ho…         o          o          o        o
#>  3 class1 student003 traditio… take-ho…         o          o          o        o
#>  4 class1 student004 traditio… open-bo…         o          o          o        o
#>  5 class1 student005 traditio… closed-…         o          o          o        o
#>  6 class1 student006 traditio… closed-…         o          o          o        o
#>  7 class1 student007 traditio… closed-…         o          o          o        o
#>  8 class1 student008 traditio… open-bo…         o          o          o        o
#>  9 class1 student009 traditio… open-bo…         o          o          o        o
#> 10 class1 student010 traditio… open-bo…         o          o          o        o
#> # ℹ 110 more rows
#> # ℹ 2 more variables: room <R(4)>, teacher <R(4)>
When you export the above edibble design using the
export_design function, the variables you are recording are
constraint to the values you expect, e.g. for factors, the cells have a
drop-down menu to select from possible values.
export_design(out, file = "/PATH/TO/FILE.xlsx")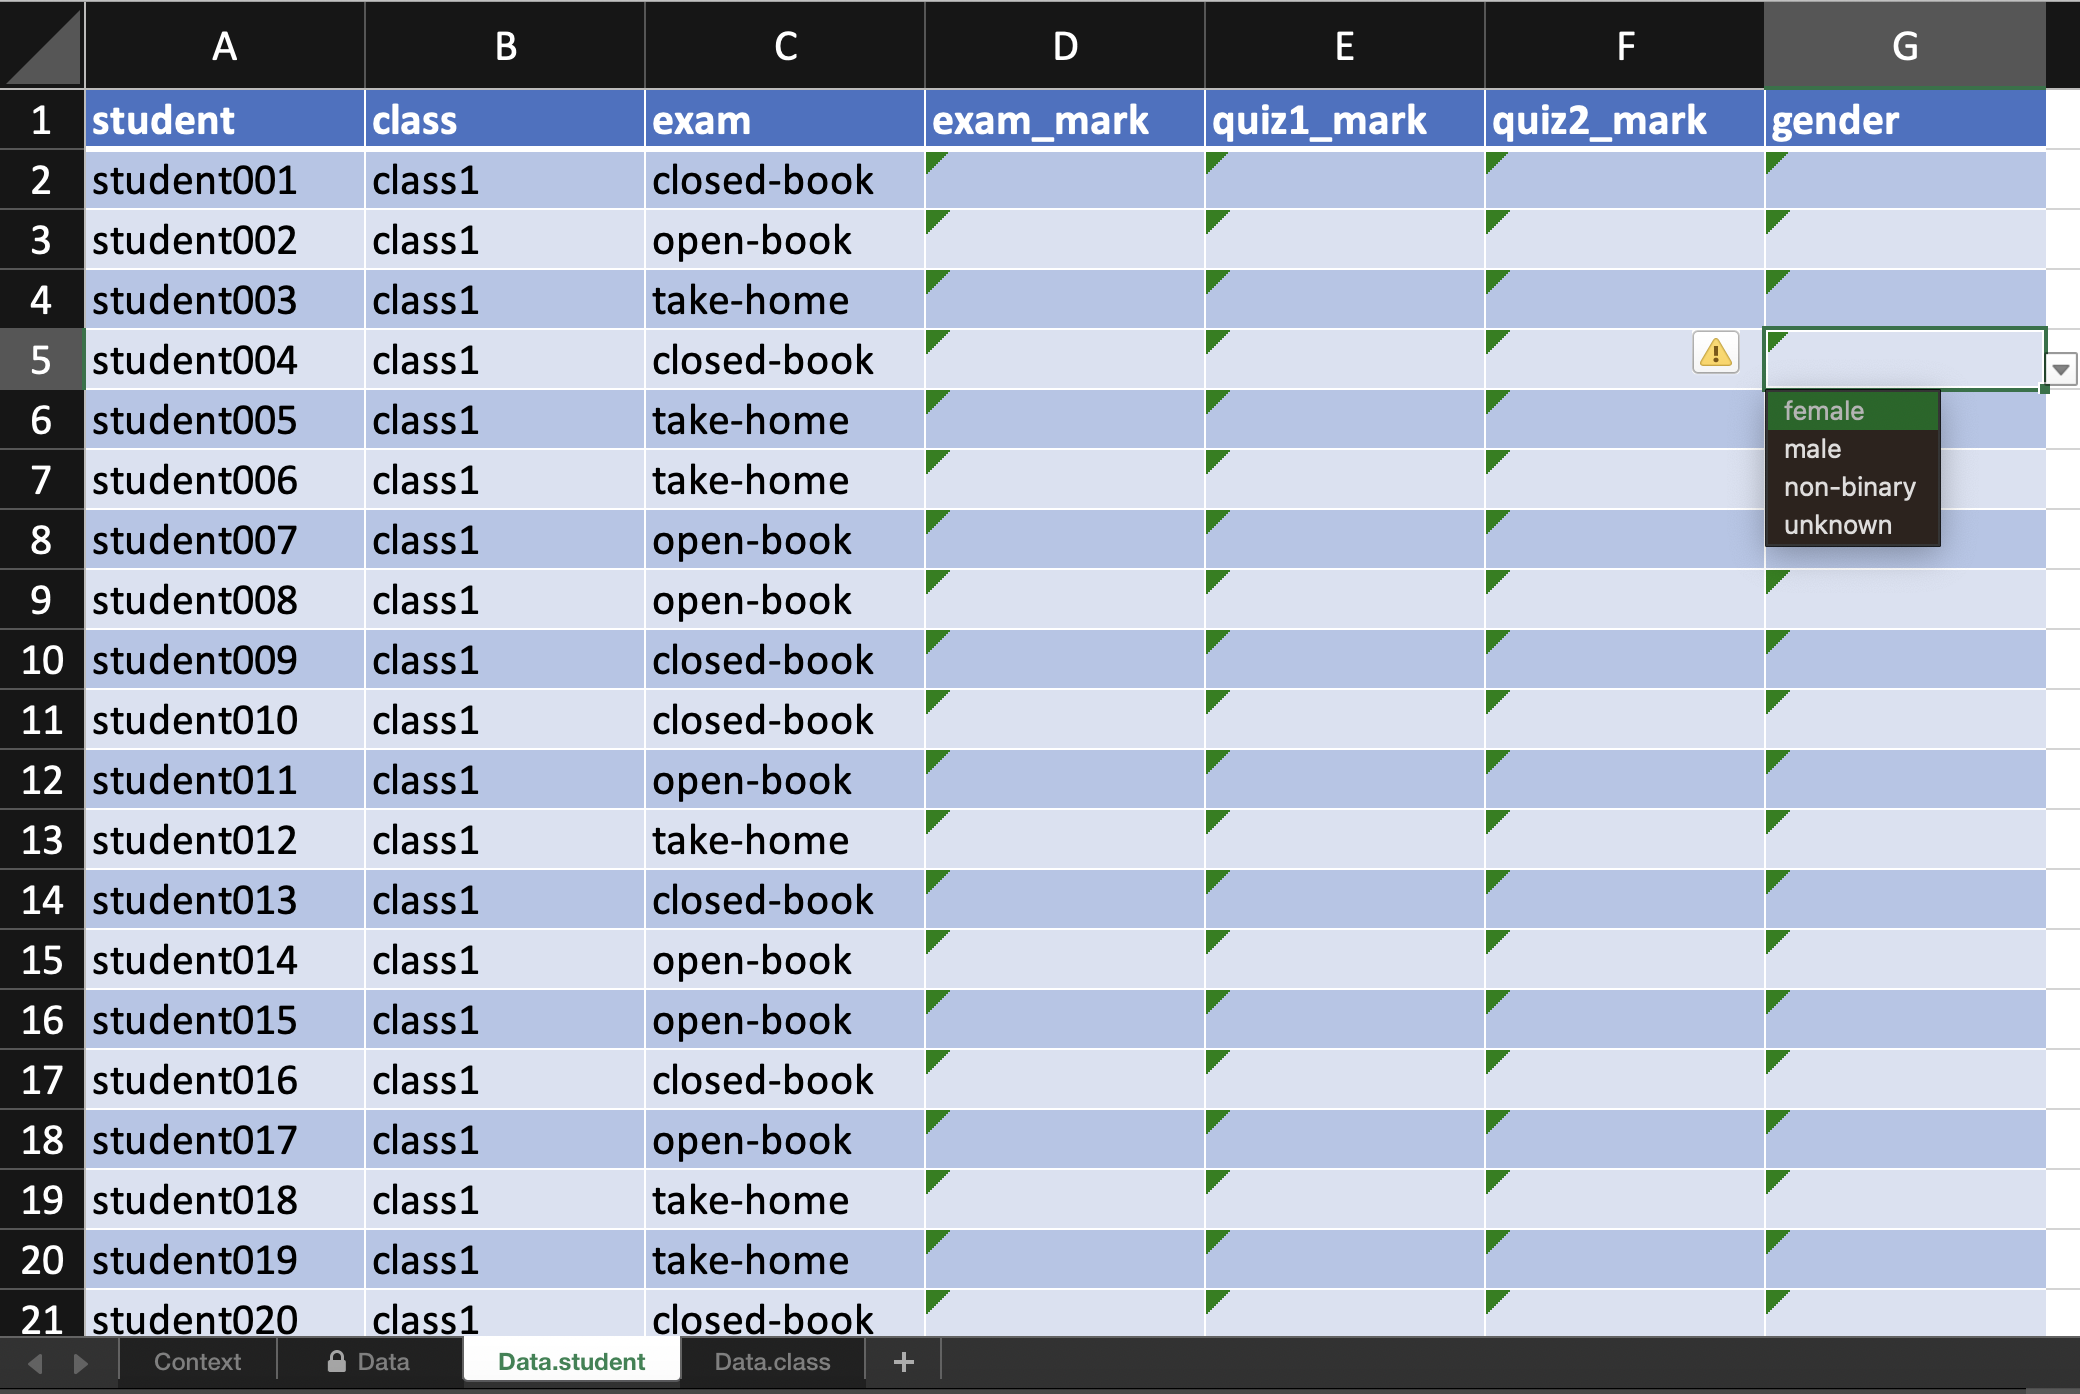
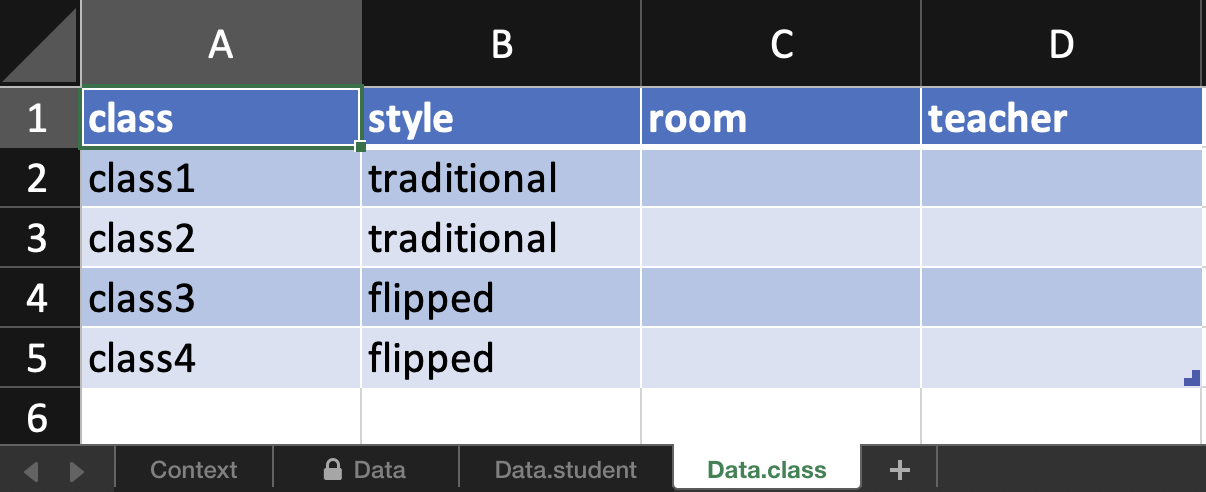
In addition, there is a spreadsheet for every observational level.
E.g. here room and teacher is the same for all
students in one class so rather than entering duplicate information,
these are exported to another sheet for data entry.
There is also support for more complex nesting structures. You can always make the structure using edibble and take the resulting data frame to use in other experimental design software. It’s also possible to bring existing data frame into edibble if you want to take advantage of the exporting feature in edibble.
design("nesting structure") %>%
  # there are 3 sites labelled A, B, C
  set_units(site = c("A", "B", "C"),
            # each site has 2 blocks except B with 3 sites
            block = nested_in(site,
                              "B" ~ 3,
                                . ~ 2),
            # levels can be specified by their number instead
            # so for below "block1" has 30 plots,
            # "block2" and "block3" has 40 plots,
            # the rest of blocks have 20 plots.
            plot = nested_in(block,
                              1 ~ 30,
                        c(2, 3) ~ 40,
                              . ~ 20)) %>%
  serve_table()
#> # nesting structure
#> # An edibble: 190 x 3
#>      site  block     plot
#>    <U(3)> <U(7)> <U(190)>
#>     <chr>  <chr>    <chr>
#>  1      A block1  plot001
#>  2      A block1  plot002
#>  3      A block1  plot003
#>  4      A block1  plot004
#>  5      A block1  plot005
#>  6      A block1  plot006
#>  7      A block1  plot007
#>  8      A block1  plot008
#>  9      A block1  plot009
#> 10      A block1  plot010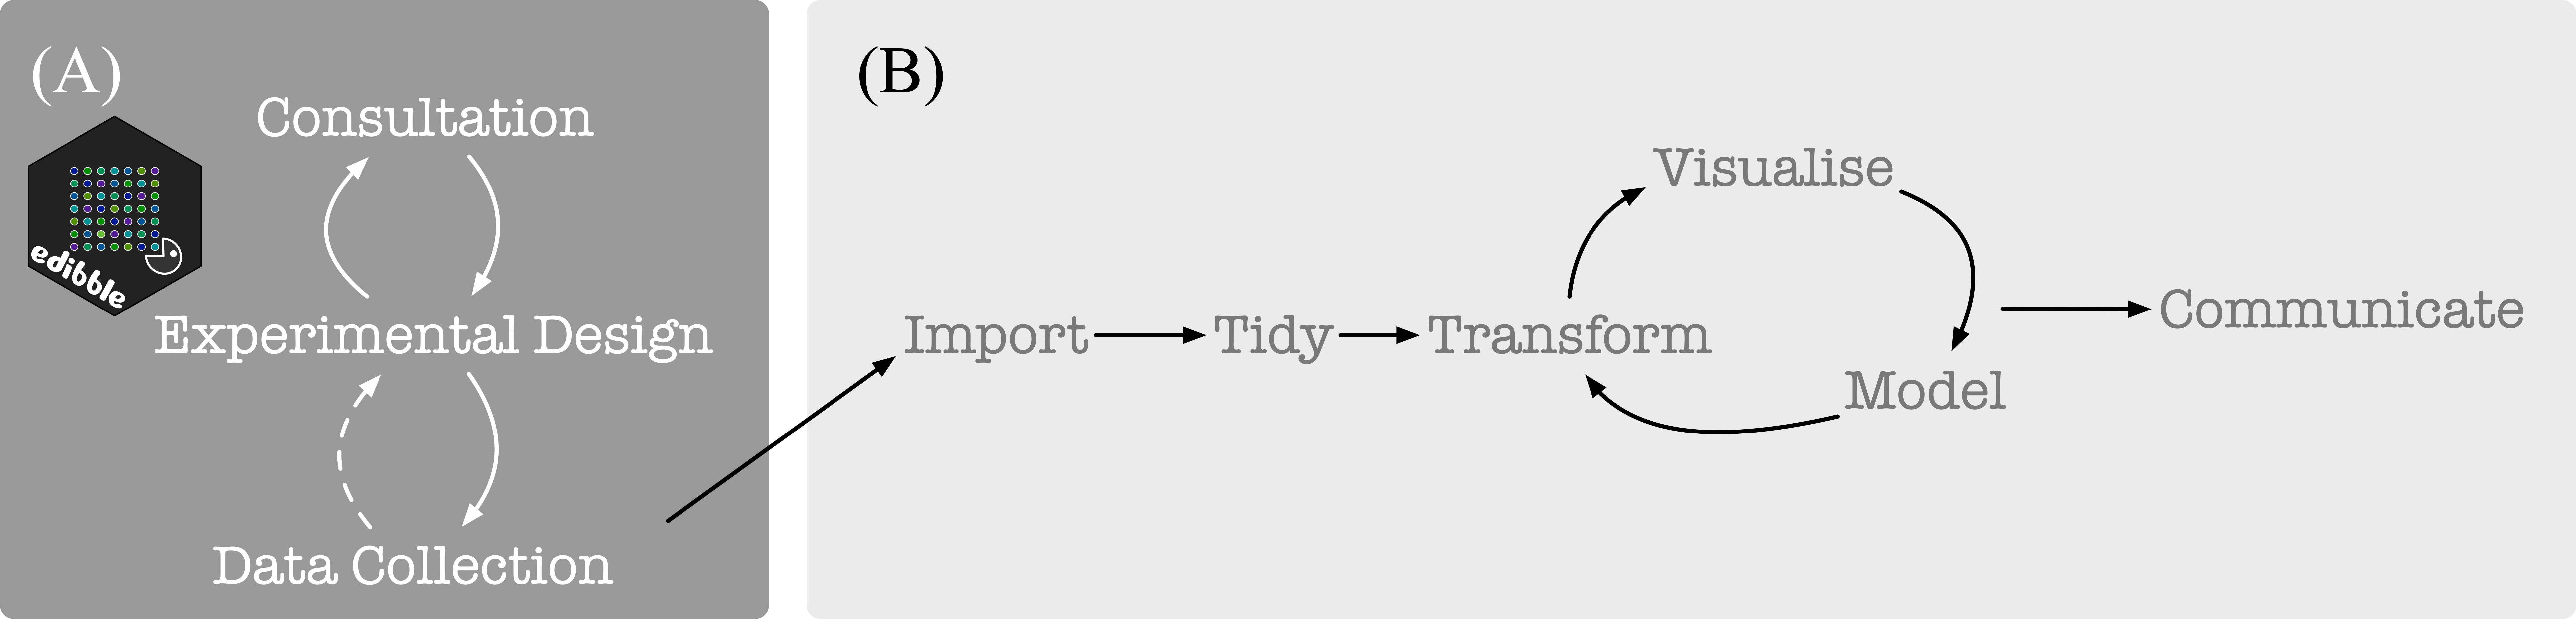
#> # ℹ 180 more rowstidyverse is well suited for the data science project workflow as
illustrated below in (B) (from Grolemund and Wickham
2017). For experimental data, the statistical aspect begins before
obtaining data as depicted below in (A). The focus of
edibble is to facilitate work in (A).
The edibble R-package differ considerably to other packages for constructing experimental design with a focus on the whole process and less on the randomisation process (which the other software generally focus and do well on). Some features include:
Currently, edibble:
The way that edibble specifies experimental design is largely novel (if I say so myself) and there are no work that resembles it. I’m concurrently working on two extension packages:
deggust - to visualise the designs constructed from
edibble as ggplot2 objects (WIP).sizzled - for experiments that require sample size
calculation (WIP).Below are some other related work. You can also have a look at the CRAN Task View for Design of Experiment and Analysis of Experimental Data for a whole collection.
DeclareDesign for survey or sampling designsdesignr for balanced factorial designs with crossed and
nested random and fixed effect to data framedae for functions useful in the design and ANOVA of
experiments (this is in fact powering the randomisation in edibble)plotdesignr for designing agronomic field
experimentsedibble is hugely inspired by the work of Tidyverse Team. I’m grateful for the dedication and work by the Tidyverse Team, as well as R Development Core Team that supports the core R ecosystem, that made developing this package possible.
The implementation in edibble adopt a similar nomenclature and design philosophy as tidyverse (and where it does not, it’s likely my shortcoming) so that tidyverse users can leverage their familiarity of the tidyverse language when using edibble. Specifically, edibble follows the philosophy:
<verb>_<noun> (e.g. set_units and
set_rcrds) where the nouns are generally plural. Exceptions
are when the subject matter is clearly singular
(e.g. design and set_context);tibble for
additions to edibble graph;dplyr::case_when (LHS is character or integer for edibble
however).Please note that the edibble project is released with a Contributor Code of Conduct. By contributing to this project, you agree to abide by its terms.