![]()
![]()
The goal of bench is to benchmark code, tracking execution time, memory allocations and garbage collections.
You can install the release version from CRAN with:
install.packages("bench")Or you can install the development version from GitHub with:
# install.packages("pak")
pak::pak("r-lib/bench")bench::mark() is used to benchmark one or a series of
expressions, we feel it has a number of advantages over alternatives.
bench::press(), which allows you to easily perform
and combine benchmarks across a large grid of values.The times and memory usage are returned as custom objects which have
human readable formatting for display (e.g. 104ns) and
comparisons (e.g. x$mem_alloc > "10MB").
There is also full support for plotting with ggplot2 including custom scales and formatting.
bench::mark()Benchmarks can be run with bench::mark(), which takes
one or more expressions to benchmark against each other.
library(bench)
set.seed(42)

dat <- data.frame(
  x = runif(10000, 1, 1000),
  y = runif(10000, 1, 1000)
)
bench::mark() will throw an error if the results are not
equivalent, so you don’t accidentally benchmark inequivalent code.
bench::mark(
  dat[dat$x > 500, ],
  dat[which(dat$x > 499), ],
  subset(dat, x > 500)
)
#> Error: Each result must equal the first result:
#> `dat[dat$x > 500, ]` does not equal `dat[which(dat$x > 499), ]`
Results are easy to interpret, with human readable units.
bnch <- bench::mark(
  dat[dat$x > 500, ],
  dat[which(dat$x > 500), ],
  subset(dat, x > 500)
)
bnch
#> # A tibble: 3 × 6
#>   expression                     min   median `itr/sec` mem_alloc `gc/sec`
#>   <bch:expr>                <bch:tm> <bch:tm>     <dbl> <bch:byt>    <dbl>
#> 1 dat[dat$x > 500, ]           151µs    202µs     4994.     377KB     36.8
#> 2 dat[which(dat$x > 500), ]    124µs    168µs     6169.     260KB     33.2
#> 3 subset(dat, x > 500)         184µs    232µs     3911.     510KB     40.3
By default the summary uses absolute measures, however relative
results can be obtained by using relative = TRUE in your
call to bench::mark() or calling
summary(relative = TRUE) on the results.
summary(bnch, relative = TRUE)
#> # A tibble: 3 × 6
#>   expression                  min median `itr/sec` mem_alloc `gc/sec`
#>   <bch:expr>                <dbl>  <dbl>     <dbl>     <dbl>    <dbl>
#> 1 dat[dat$x > 500, ]         1.22   1.20      1.28      1.45     1.11
#> 2 dat[which(dat$x > 500), ]  1      1         1.58      1        1
#> 3 subset(dat, x > 500) 1.48 1.38 1 1.96 1.21bench::press()bench::press() is used to run benchmarks against a grid
of parameters. Provide setup and benchmarking code as a single unnamed
argument then define sets of values as named arguments. The full
combination of values will be expanded and the benchmarks are then
pressed together in the result. This allows you to benchmark a
set of expressions across a wide variety of input sizes, perform
replications and other useful tasks.
set.seed(42)

create_df <- function(rows, cols) {
  out <- replicate(cols, runif(rows, 1, 100), simplify = FALSE)
  out <- setNames(out, rep_len(c("x", letters), cols))
  as.data.frame(out)
}

results <- bench::press(
  rows = c(1000, 10000),
  cols = c(2, 10),
  {
    dat <- create_df(rows, cols)
    bench::mark(
      min_iterations = 100,
      bracket = dat[dat$x > 500, ],
      which = dat[which(dat$x > 500), ],
      subset = subset(dat, x > 500)
    )
  }
)
#> Running with:
#>    rows  cols
#> 1  1000     2
#> 2 10000     2
#> 3  1000    10
#> 4 10000    10

results
#> # A tibble: 12 × 8
#>    expression  rows  cols      min   median `itr/sec` mem_alloc `gc/sec`
#>    <bch:expr> <dbl> <dbl> <bch:tm> <bch:tm>     <dbl> <bch:byt>    <dbl>
#>  1 bracket     1000     2     27µs     34µs    27964.   15.84KB     19.6
#>  2 which       1000     2   25.7µs   33.4µs    29553.    7.91KB     17.7
#>  3 subset      1000     2   45.9µs   58.2µs    16793.    27.7KB     17.1
#>  4 bracket    10000     2   64.1µs   70.8µs    13447.  156.46KB     40.5
#>  5 which      10000     2   46.7µs   54.7µs    17586.   78.23KB     23.3
#>  6 subset     10000     2  116.2µs  132.1µs     7228.  273.79KB     40.9
#>  7 bracket     1000    10   77.2µs   85.4µs    11335.   47.52KB     19.9
#>  8 which       1000    10   67.8µs   75.2µs    13073.    7.91KB     23.2
#>  9 subset      1000    10   84.7µs  107.5µs     9281.   59.38KB     18.8
#> 10 bracket    10000    10  130.2µs  169.1µs     5799.   469.4KB     52.2
#> 11 which      10000    10   75.1µs     96µs    10187.   78.23KB     17.4
#> 12 subset 10000 10 222.7µs 253µs 3810. 586.73KB 43.3ggplot2::autoplot() can be used to generate an
informative default plot. This plot is colored by gc level (0, 1, or 2)
and faceted by parameters (if any). By default it generates a beeswarm
plot, however you can also specify other plot types
(jitter, ridge, boxplot,
violin). See ?autoplot.bench_mark for full
details.
ggplot2::autoplot(results)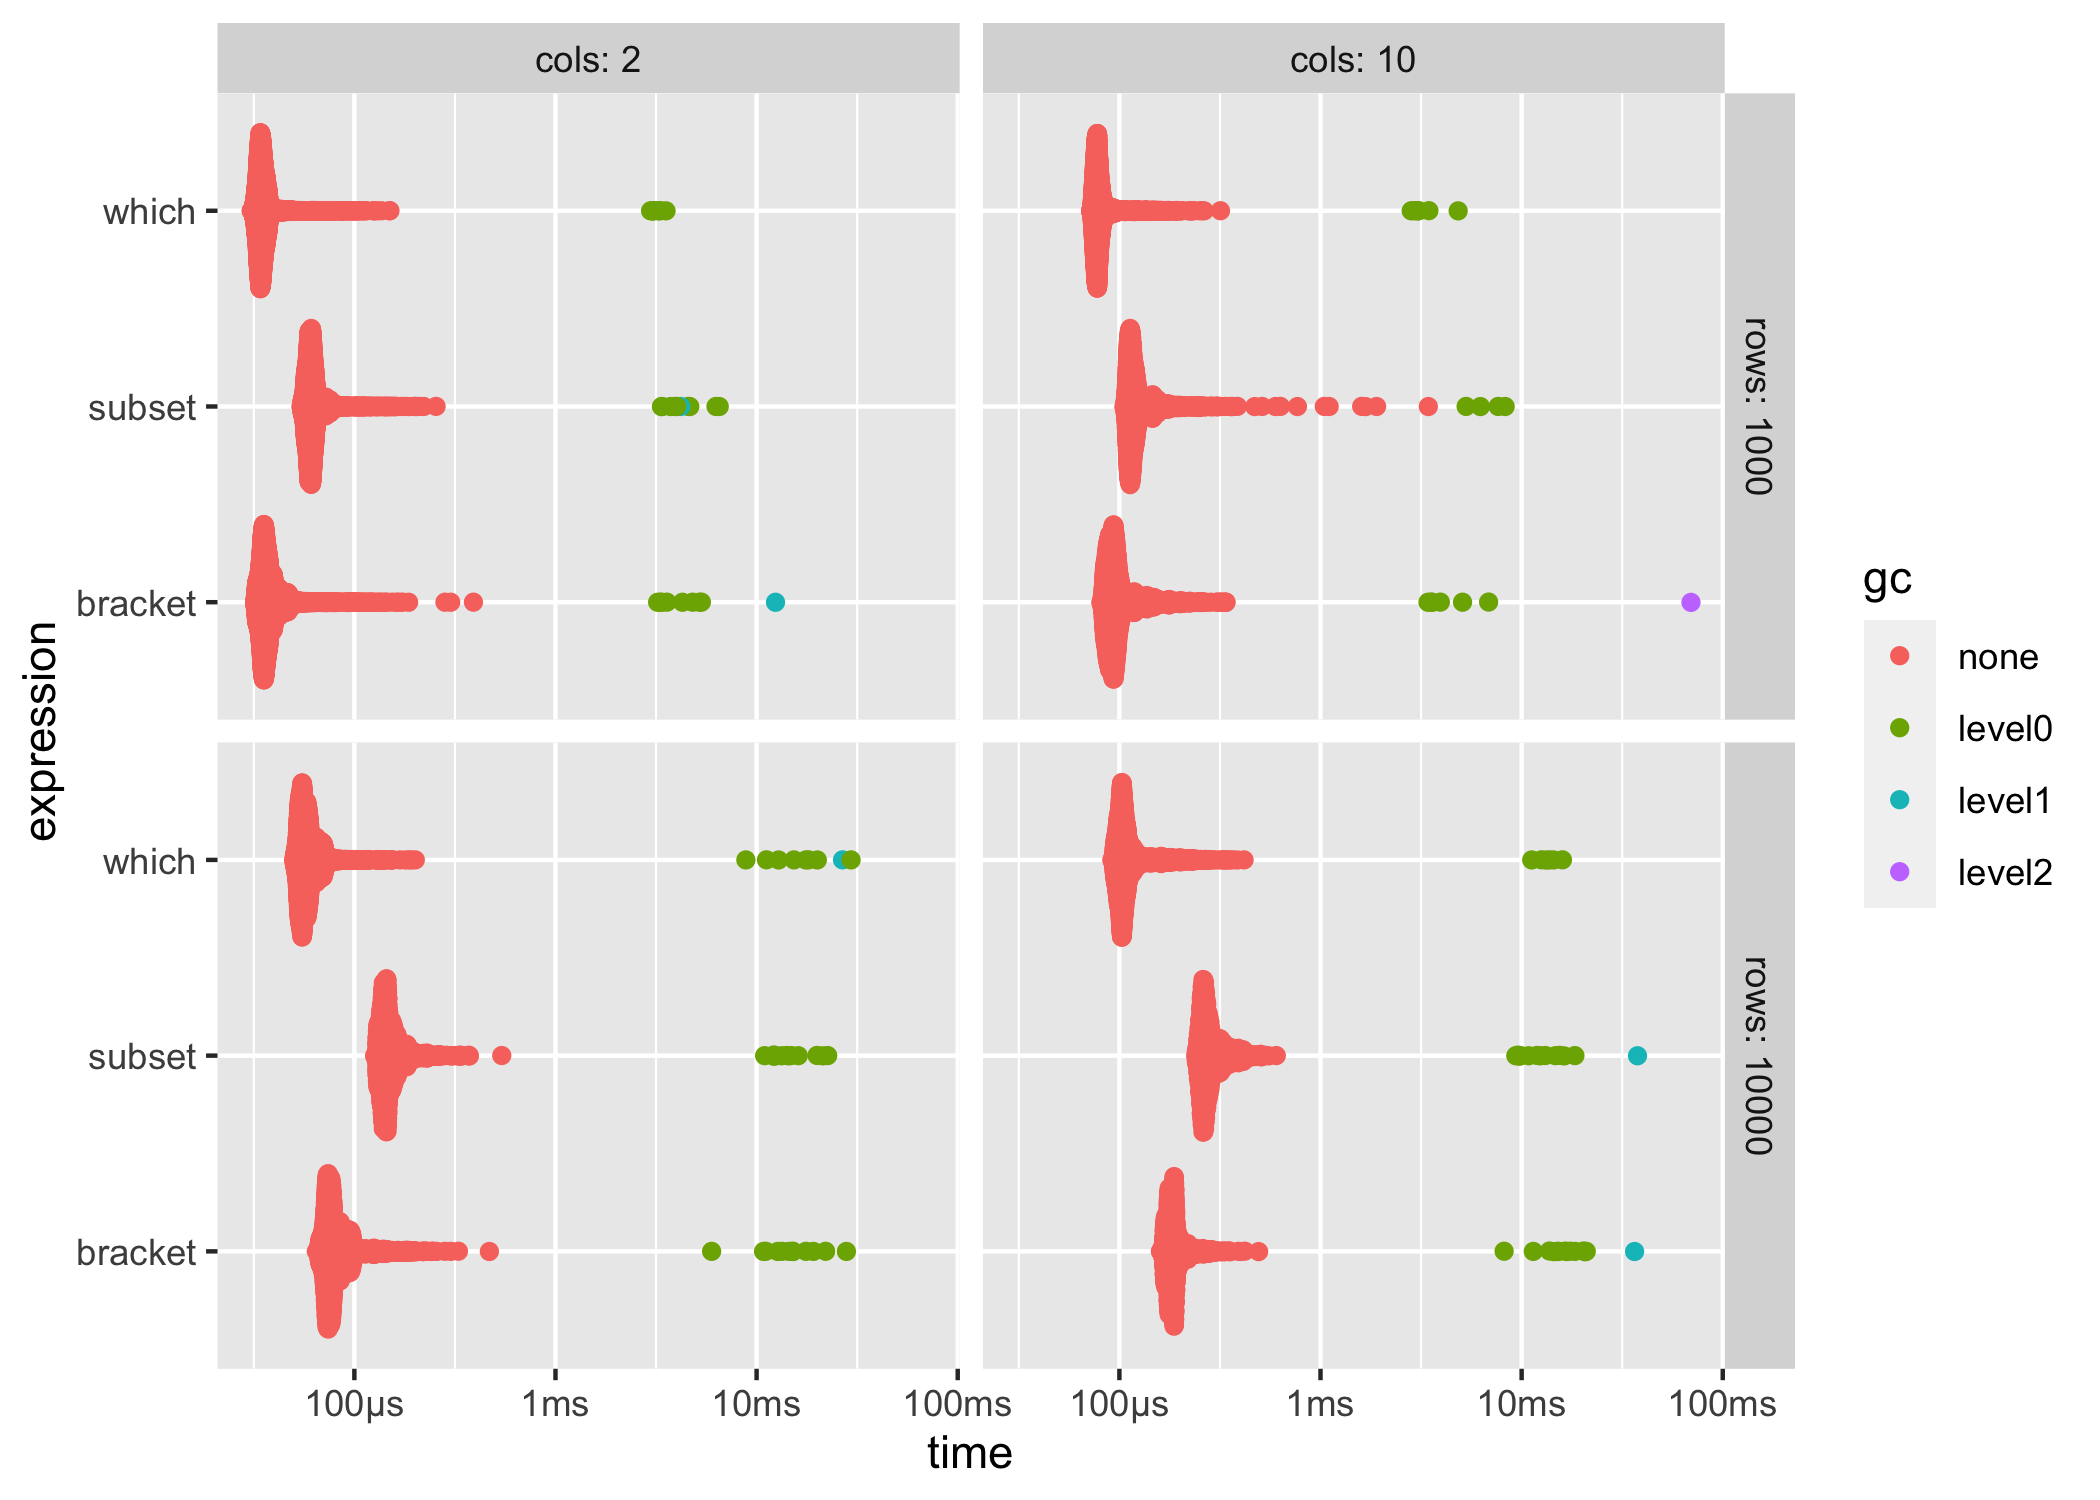
You can also produce fully custom plots by un-nesting the results and working with the data directly.
library(tidyverse)

results %>%
  unnest(c(time, gc)) %>%
  filter(gc == "none") %>%
  mutate(expression = as.character(expression)) %>%
  ggplot(aes(x = mem_alloc, y = time, color = expression)) +
  geom_point() +
  scale_color_bench_expr(scales::brewer_pal(type = "qual", palette = 3))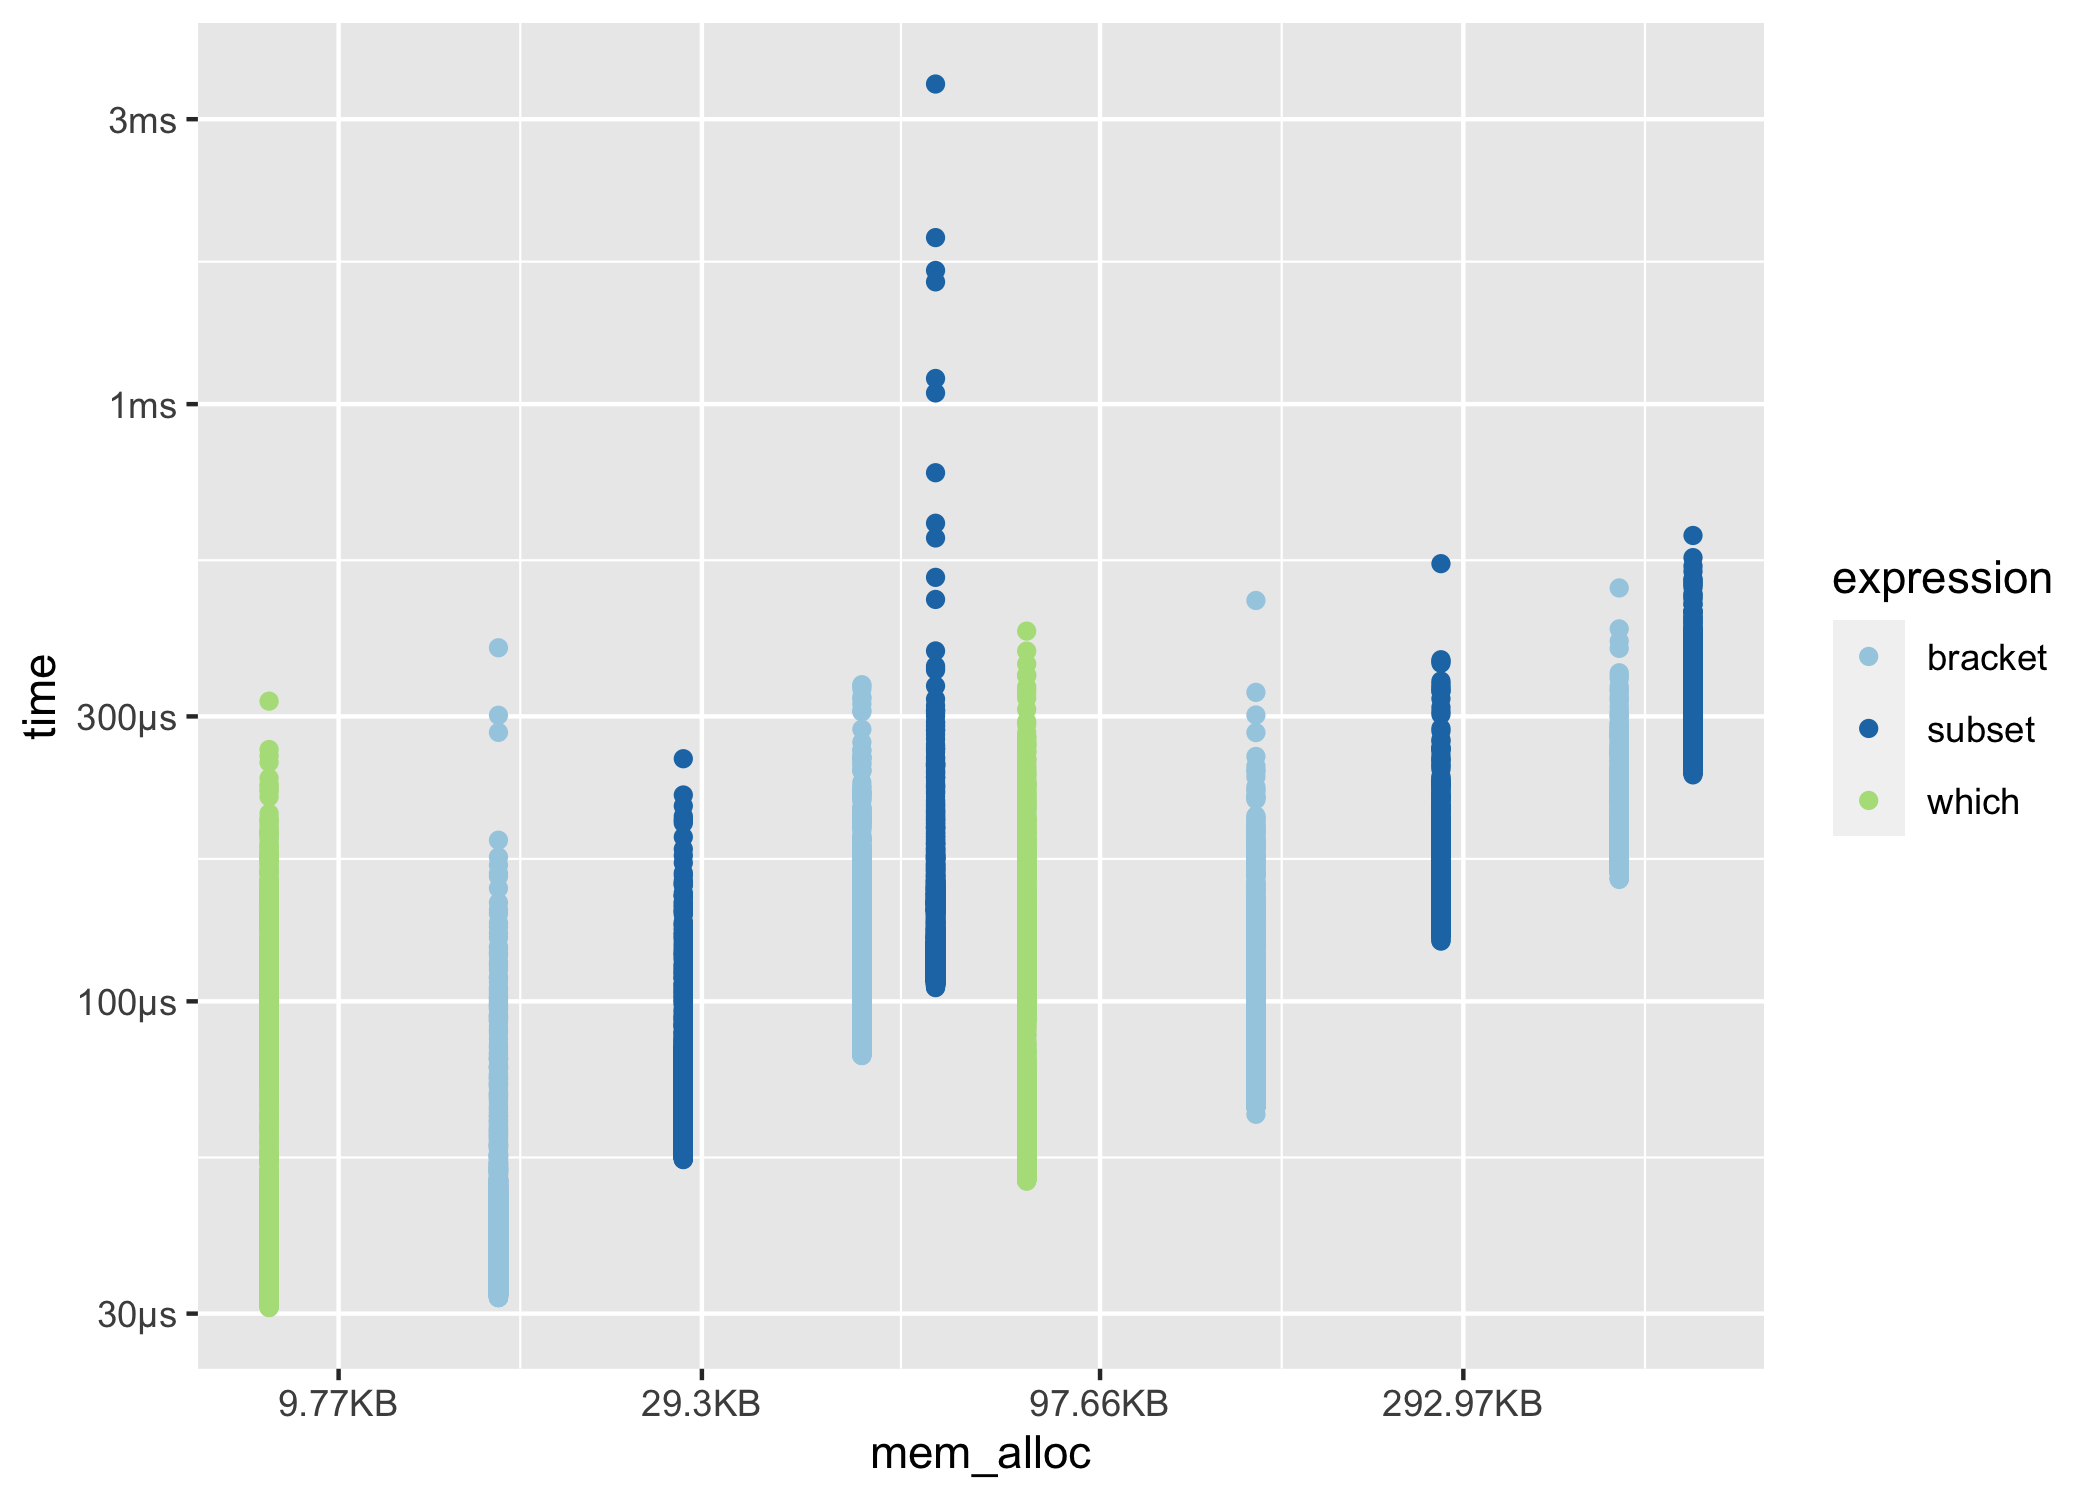
system_time()bench also includes system_time(), a
higher precision alternative to system.time().
bench::system_time({
  i <- 1
  while (i < 1e7) {
    i <- i + 1
  }
})
#> process    real
#>   1.73s    1.7s

bench::system_time(Sys.sleep(.5))
#> process    real
#>    58µs   497ms